Make inspecting your business effortless.
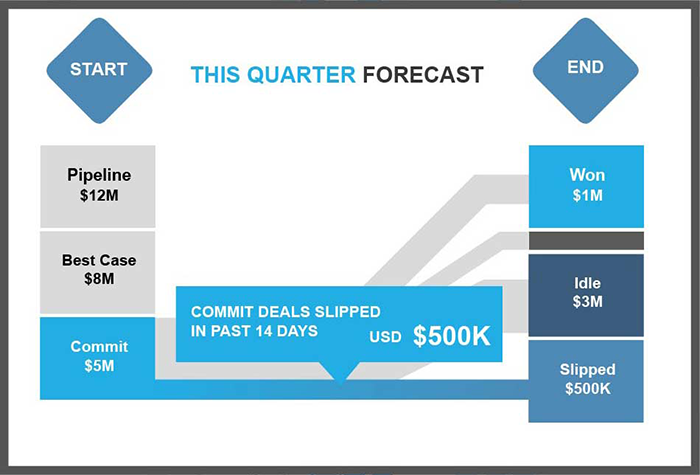
FunnelFlow picks up where Salesforce leaves off by providing the complete story of pipeline movement in straightforward visuals. Gain a comprehensive view of your funnel to help understand what’s changing and why, so you can quickly identify risk and respond proactively.
- Track important changes to the forecast across multiple points in time.
- See where you were last week, month, or quarter compared to today.
- Dig into deals that caused your number to shift.
- Easily see which deals have slipped out of the forecast.
- View who changed their commits since the last review call.
- Segment changes by opportunity type, team, user and more.
- Quickly generate board-level trending graphs from historical data.
Yes, I want a demo.


View changes to the funnel between any two points in time. Create Flows for different business segments, opportunity types, teams and more.


Drill into the Flow chart to see the underlying opportunity change details in a customizable data table. Understand exactly what changed on each opportunity.

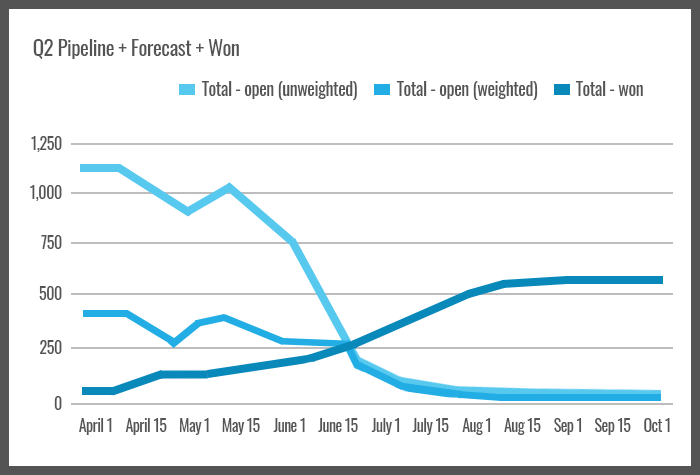
Quickly generate powerful trend graphs of the pipeline, forecast, and wins at multiple points in time – ideal for board reports and QBRs.
FunnelSource, Inc. | (800) 395-7085 | sales@funnelsource.com | Visit us on the Salesforce AppExchange